The Revenue Cycle Runs Both Ways: Turning AI Into a Shield for 530,000 Families a Year
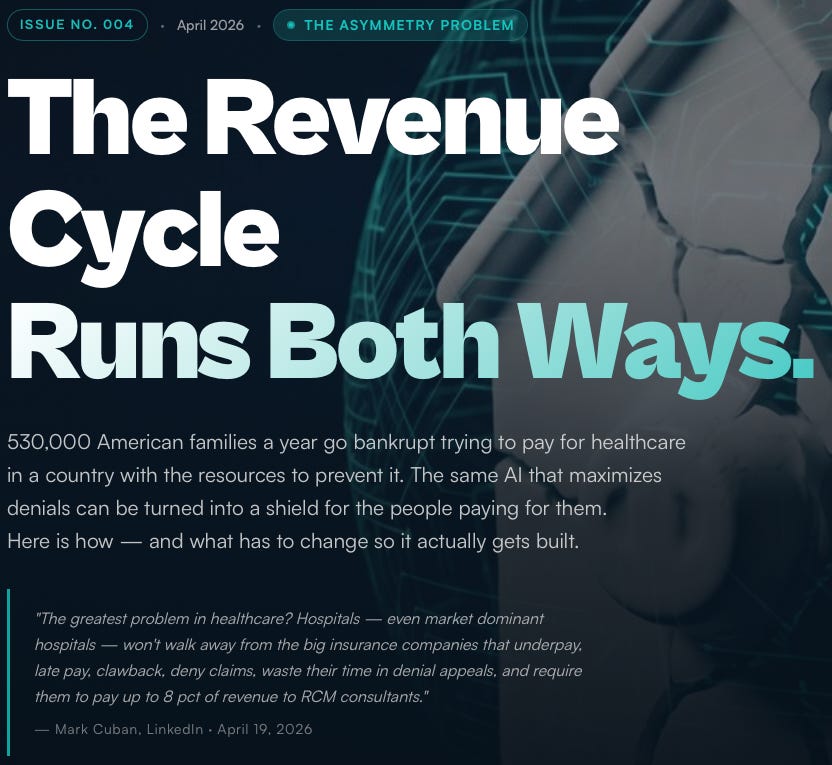
530,000 American families go bankrupt each year from healthcare costs in a country rich enough to prevent it. The same AI used to maximize revenue can be turned into a shield for these families.

Last week Mark Cuban stood in front of a room of policymakers and said, out loud, what practitioners have been saying in private for a decade. The biggest problem in American healthcare is not that the drugs don’t exist, or that the doctors don’t exist, or that the hospitals don’t exist. It is that the money to pay for them — already inside the system — does not reach the people who need it in time to stop their lives from coming apart.
About 530,000 American families a year are driven into bankruptcy by medical bills. That number does not come from a headline or a lobbying deck. It comes from Himmelstein, Lawless, Thorne, Foohey, and Woolhandler in the American Journal of Public Health, which found that roughly two-thirds of all personal bankruptcies in the U.S. involve a medical cause — medical bills, lost income from illness, or both. More recent work — the Commonwealth Fund’s 2024 Biennial Survey, KFF’s medical debt work, the CFPB’s medical debt reports — tells the same story from different angles. There is roughly $200 billion of unpaid medical debt on U.S. household balance sheets, and nearly one in four insured adults is effectively underinsured, meaning their out-of-pocket costs eat more than 10% of household income.
At the same time, the country already carries resources specifically designed to stop this. Roughly $28 billion a year in federal tax breaks to nonprofit hospitals, in exchange for charity care they are legally required to provide. Billions in premium tax credits. Medicaid presumptive eligibility. The No Surprises Act and its Independent Dispute Resolution process. State medical debt programs. And a growing set of nonprofits and startups that exist for no purpose other than getting covered people the coverage they already qualify for.
So why does the plane still crash?
Because the current revenue cycle — the apparatus that moves money between patient, provider, and payer — is structurally asymmetric. It is highly optimized on the side that wants to collect, and almost entirely manual on the side that has to pay. AI has poured into the collect side: denial engines, automated prior auth, coding uplift, clawback automation, dunning. AI has barely touched the pay side: a patient still gets a paper bill, a phone tree, a three-line denial letter, and no model on their team.
This issue is about whether that asymmetry is a permanent feature of the system or a policy choice. The argument below is that it is a policy choice — and that the same infrastructure now being used to maximize revenue from patients can, with different rules and different operators, be turned around to maximize benefits owed to patients. Not as speculation. As a stack that already partly exists.
“Don’t be a wimp. Seriously.”
— MARK CUBAN TO LAWMAKERS ON BREAKING UP PBMS · POLITICO HEALTHCARE SUMMIT, APRIL 21, 2026
Cuban’s role in this is less about the pharmacy he built than about the permission structure he has been creating. By naming CVS Caremark, Express Scripts, and OptumRx in public, by publishing the list prices his facility pays, by calling out employer CEOs for not negotiating better, he has made it normal to treat healthcare pricing and denial the way we treat any other supplier negotiation: as a leverage problem. That framing is what this issue tries to extend. The hard part is not writing an op-ed. It is building the infrastructure that lets a family who cannot afford a $14,000 emergency department bill have a chance of not being crushed by it.
THE NUMBER
530,000 families a year — and who they actually are
Medical bankruptcy in the United States is not a tail risk for the uninsured. It is a middle-class event, and the triggers are mundane.
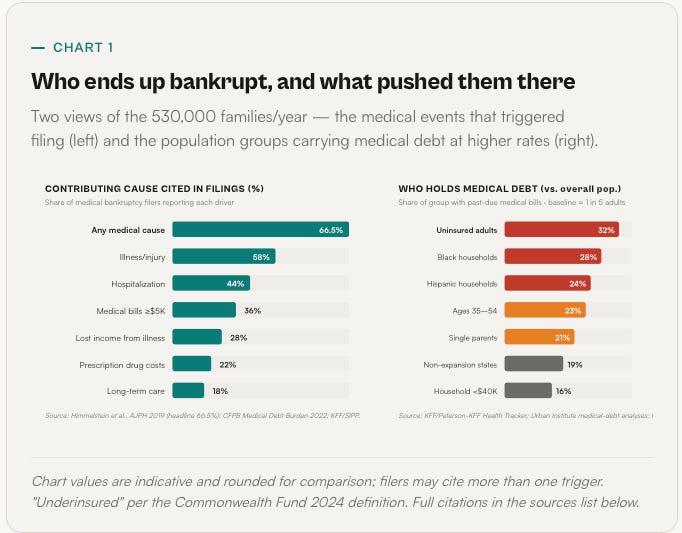
The Himmelstein team’s 2019 AJPH paper is still the cleanest number we have: roughly 66.5% of personal bankruptcies in the U.S. cite a medical cause, which translates to about 530,000 families filing for bankruptcy each yearwith medical bills or illness-driven income loss contributing materially. Subsequent work by the Commonwealth Fund and KFF finds that the underlying affordability crisis has widened, not narrowed, since then.
Three things about that number are worth sitting with before we go any further.
First, most of these families have insurance. The Commonwealth Fund’s 2024 Biennial survey found that 23% of insured adults are underinsured — meaning their deductibles and out-of-pocket spending consume more than 10% of household income (5% for lower-income families). Medical bankruptcy is largely an underinsured story, not an uninsured story. That is important because the “just get covered” framing — the default political answer for a decade — does not describe what is actually breaking.
Second, the triggers are routine. A single hospitalization is the modal event — one in four bankruptcy filers cite a specific stay. Cancer and chronic disease account for another large share. Commonwealth Fund analyses and KFF data consistently show that unpaid hospital bills are the single largest category of medical debt, followed by out-of-pocket prescription costs and ambulance/ED charges. Dental and behavioral health debt is also material and often invisible in official statistics.
Third, the demographic pattern is not random. Black and Hispanic households are disproportionately represented. Single-parent households are over-represented. Residents of non-Medicaid-expansion states are over-represented. And — this is the quiet one — the age group most likely to carry medical debt in collections is working-age adults between roughly 35 and 54, not retirees. The system is not mostly failing the elderly. It is failing people who are in the middle of building their working lives.
One more piece of the picture — policy has moved in the wrong direction over the last year. The CFPB’s January 2025 rule would have removed roughly $49 billion of medical debt from the credit reports of an estimated 15 million Americans. It was vacated by a federal court in the Eastern District of Texas on July 11, 2025, which also signaled that the Fair Credit Reporting Act preempts state-level medical debt credit bans — putting about fifteen state laws in legal jeopardy. Add to that the post-pandemic Medicaid unwinding (over 25 million redeterminations, many procedural disenrollments), the expiration of enhanced ACA subsidies on the current schedule, and eligibility redeterminations every six months under the “One Big Beautiful Bill” — and the forward trend on medical bankruptcy exposure is worse than the historical data says.
THE ASYMMETRY
Revenue cycle AI is real. But it is not on the patient’s side of the table.
The popular framing — “healthcare already has the most sophisticated AI stack in the economy” — is simply not true. Finance, consumer, and logistics are further along. What healthcare does have is a narrow, well-capitalized AI capability for one very specific job: moving money from patient to payer to provider faster. That capability has been built almost entirely on the revenue-capture side.
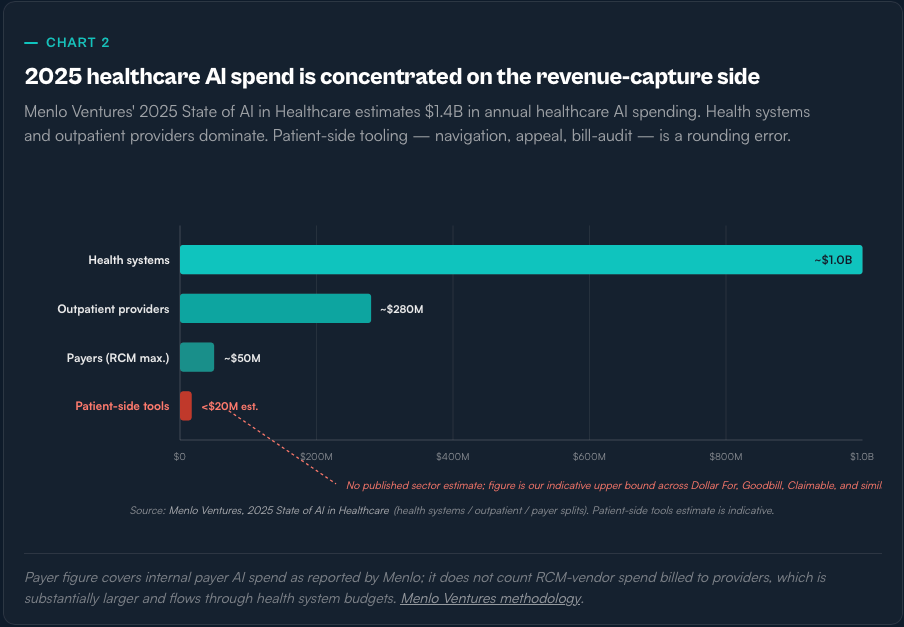
The RCM AI stack is real. It is also bounded. A peer-reviewed JAMIA 2025 survey of 43 health systems found that only 23% of organizations deploying revenue-cycle AI report a “high degree of success” — the lowest success rate of any AI category surveyed. Vendors’ marketing numbers — 23% faster denial appeal drafting from Epic’s Penny; 90% faster appeal-package generation from Waystar — are real but represent narrow productivity gains, not an order-of-magnitude transformation of the financial experience.
On the denial side, the evidence of harm is well documented. UnitedHealth’s nH Predict algorithm — used to adjudicate post-acute rehab care for Medicare Advantage members — is alleged in the Estate of Lokken class action to have a 90% error rate on appealed denials, with only 0.2% of denied patients appealing — so the reversal rate produces no real pressure back on the algorithm. Cigna’s PXDX tool, per a ProPublica investigation, allowed its physicians to reject 300,000 claims in two months at 1.2 seconds per case. MedPAC, via USC Schaeffer analyses, estimates Medicare Advantage upcoding adds roughly $50 billion a year in payments to plans; HHS OIG flagged $7.5 billion in overpayments from MA Health Risk Assessments in 2023 alone.
The structural point is not that every insurer is running nH Predict. It is that the AI money, the AI talent, and the AI product-market fit in healthcare right now all sit on the side of the transaction that has an incentive to collect more, deny more, and appeal less. The other side of the table — 530,000 families a year, and the tens of millions who live one ED visit away from them — is still, for the most part, holding a phone and a paper bill.
THE PARADOX
The money to prevent this is already in the system
Charity care, subsidies, IDR, state programs — most of the resources designed to keep families out of bankruptcy already exist. Most of them don’t reach the people they were built for.
Take the cleanest example. Nonprofit hospitals — about 3,000 facilities, roughly 60% of all U.S. hospitals — receive federal, state, and local tax exemptions collectively worth an estimated $28 billion a year. In exchange, under IRS Section 501(r), they are required to publish a financial assistance policy, screen patients for eligibility before collection actions, and limit what they charge eligible patients.
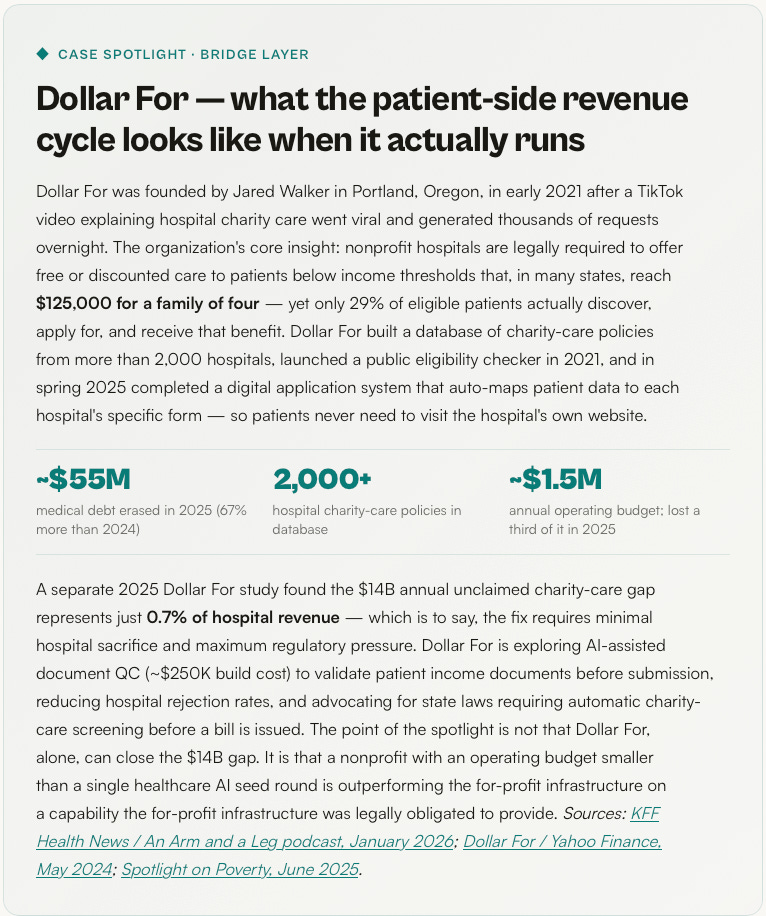
The Lown Institute’s 2024 Fair Share Spending analysis found a $25.7 billion gapbetween the value of nonprofit hospital tax breaks and the community investment those hospitals reported. Separate research from the nonprofit Dollar For quantifies the charity-care-specific piece: hospitals collectively fail to deliver at least $14 billion a year in charity care they were legally obligated to provide, and only about 29% of eligible patients actually move from discovery to approved financial assistance. More than half of patients surveyed were not given any information about financial assistance by the hospital at all. Black patients were 62% less likely to be approved than patients of other races.
Charity care is only one of the leaky resource pools. A similar pattern shows up across the system:
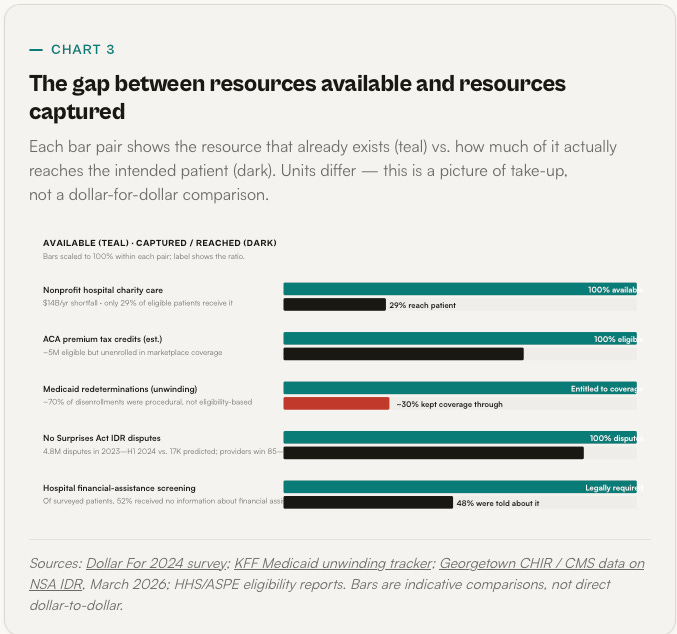
The pattern is consistent. Resources exist. Take-up is low. The infrastructure that could raise take-up — eligibility checks, application prefill, subsidized enrollment, automated charity-care screening — is technically trivial. It is just not built by anyone whose revenue depends on it.
That last sentence is the one worth reading twice. The same data flows that feed a collection engine could, with different incentives, feed a benefits engine.Eligibility for Medicaid, for hospital charity care, for marketplace subsidies, for state assistance programs, for manufacturer patient-assistance drugs — all of it is computable from information the health system already has: income, household size, residency, insurance status, diagnosis codes, discharge data. The pay-side revenue cycle is not a technical problem. It is an assignment problem: who is accountable for running it, and whose side they sit on.
COUNTER-RCM
A three-layer stack for the patient side of the table
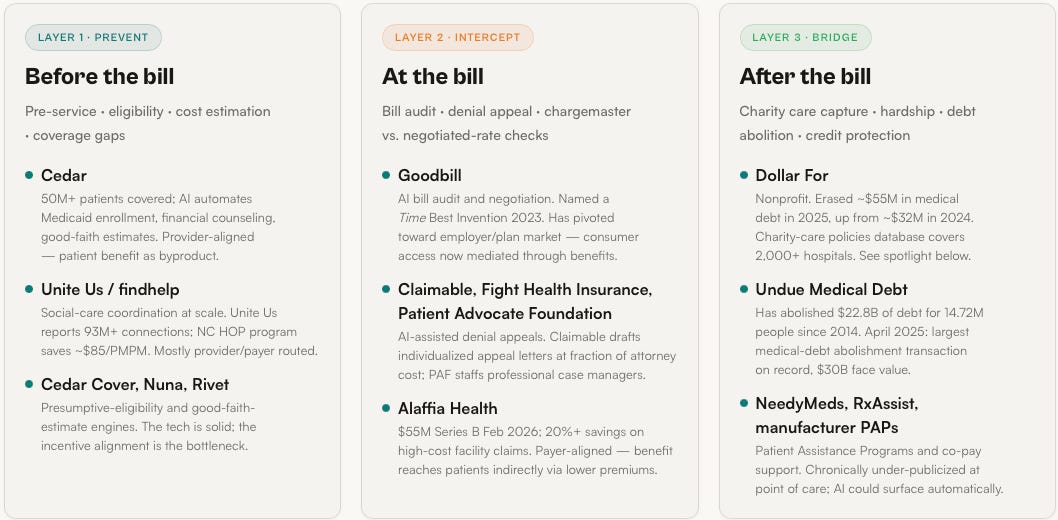
The tools to turn RCM inside-out already exist in pieces. They have not been assembled. The structure below maps the pieces to the three moments when the fight is lost — before the bill, at the bill, and after the bill.
The rule of thumb is simple: every dollar a patient is billed is either avoidable, disputable, or bridgeable. Each of those three verbs maps to a distinct AI capability, a distinct operator, and a distinct policy lever. And each has at least one production-grade example — from payer-aligned startups to patient-funded nonprofits — already running.
FORCE MULTIPLIERS
Arming the people already fighting on the patient’s side
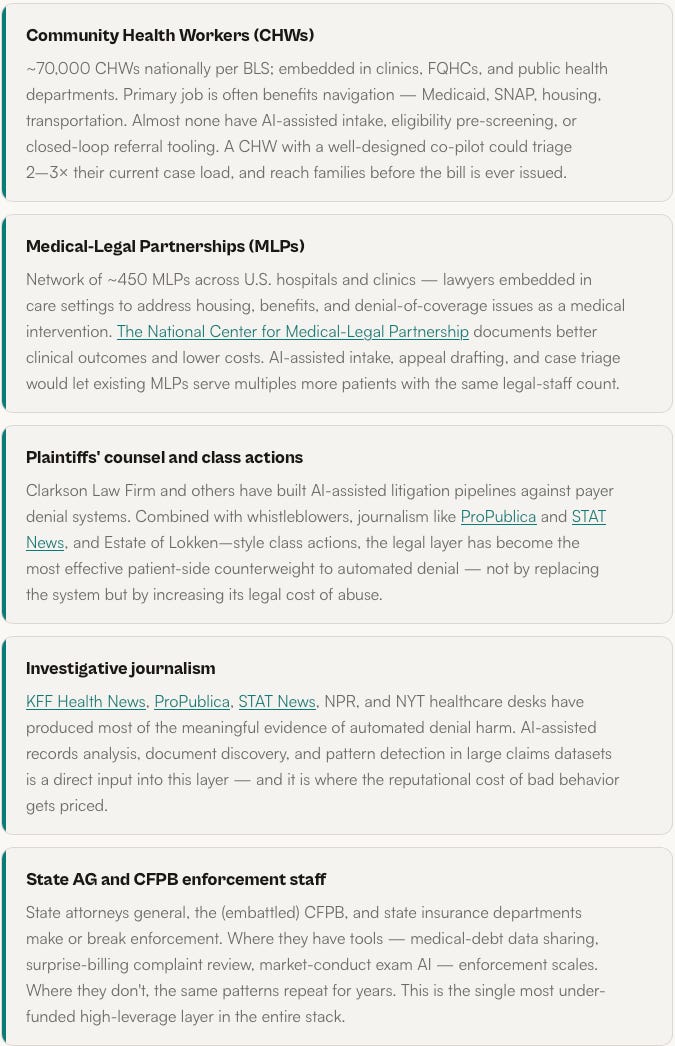
AI built for the patient cannot mostly be an app. The highest-leverage deployment is giving better tools to the professionals and volunteers who already help families navigate the system one case at a time.
There is a second myth worth naming. Medical bankruptcy is not, mostly, a problem of educated patients making bad choices — it is a problem of ordinary people hitting an intentionally complex administrative wall with no one on their side. The people who are already on that side are underfunded, overloaded, and mostly working on paper and phone calls. Before we ask who the next Dollar For is, we should ask how much more the existing field can do with better tooling.
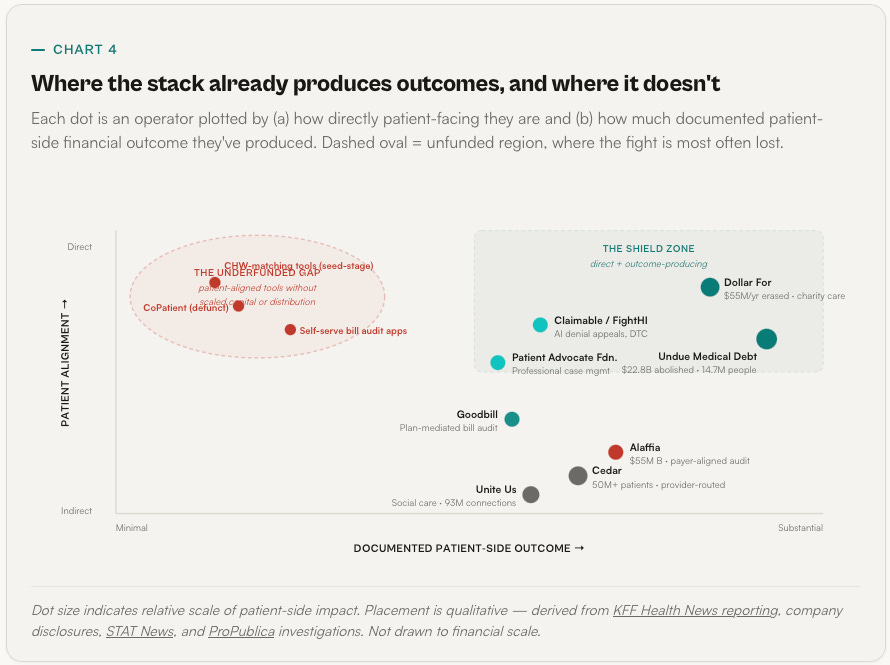
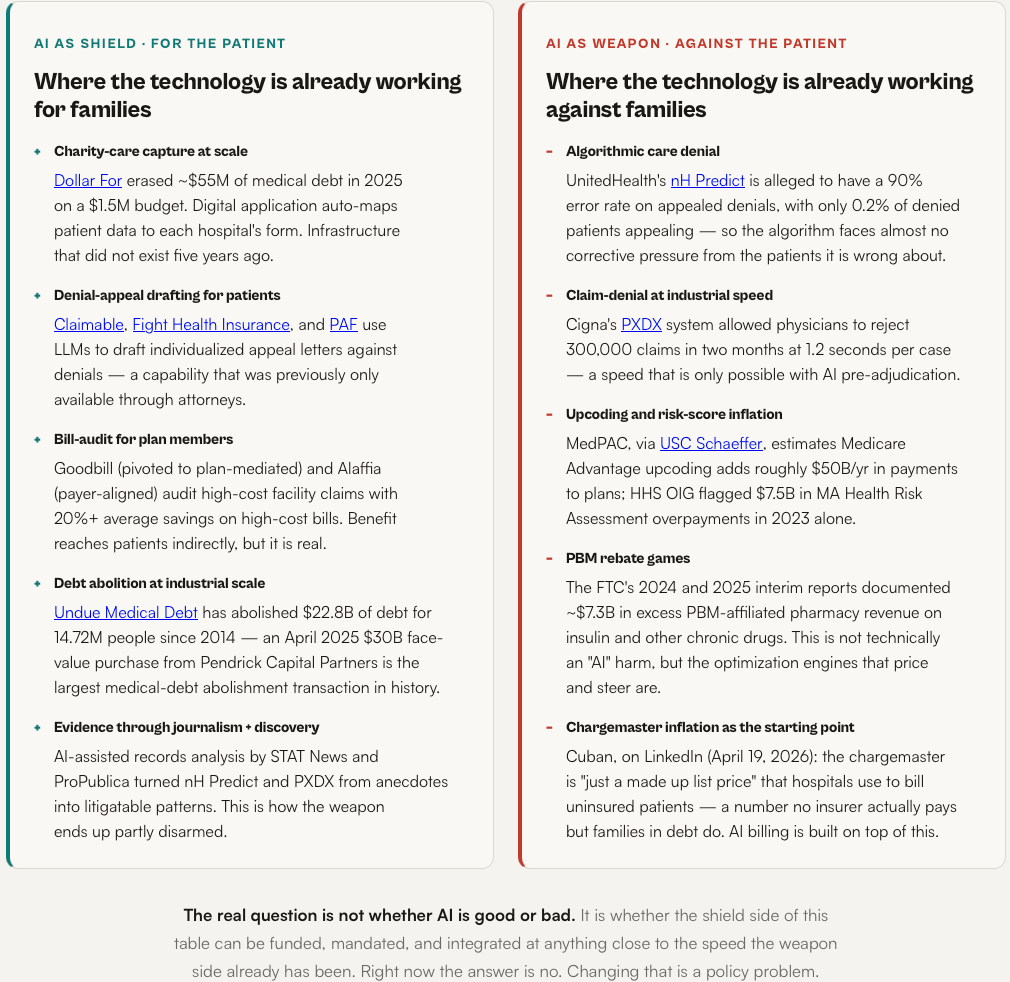
BALANCED PANEL
Same technology. Two different sides of the table.
The honest answer to “is AI good or bad for patients?” is that it depends on who pays for it and what problem they told it to solve. Below, the same capability class shown as both shield and weapon — with named examples on each side.
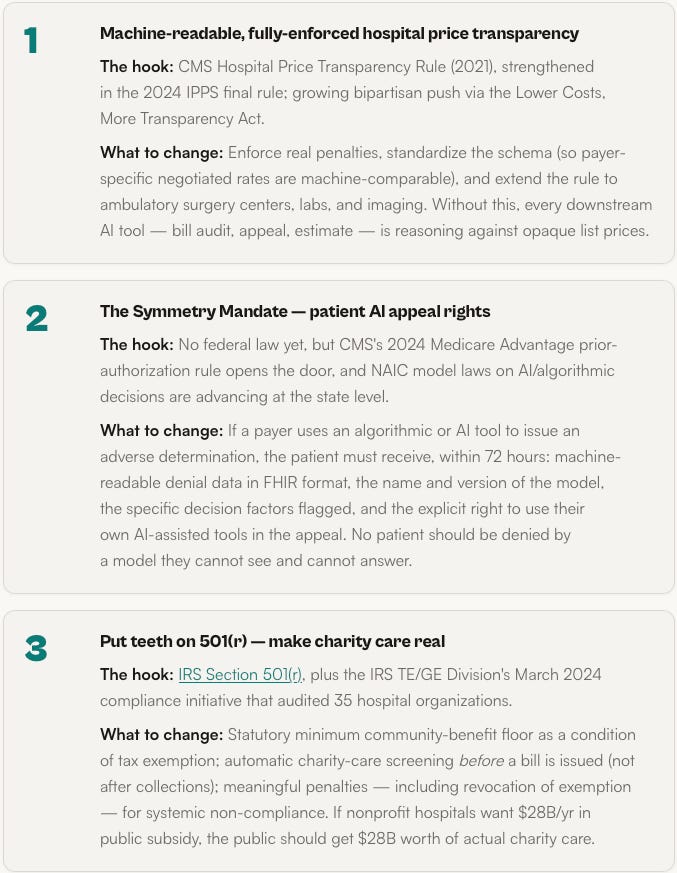
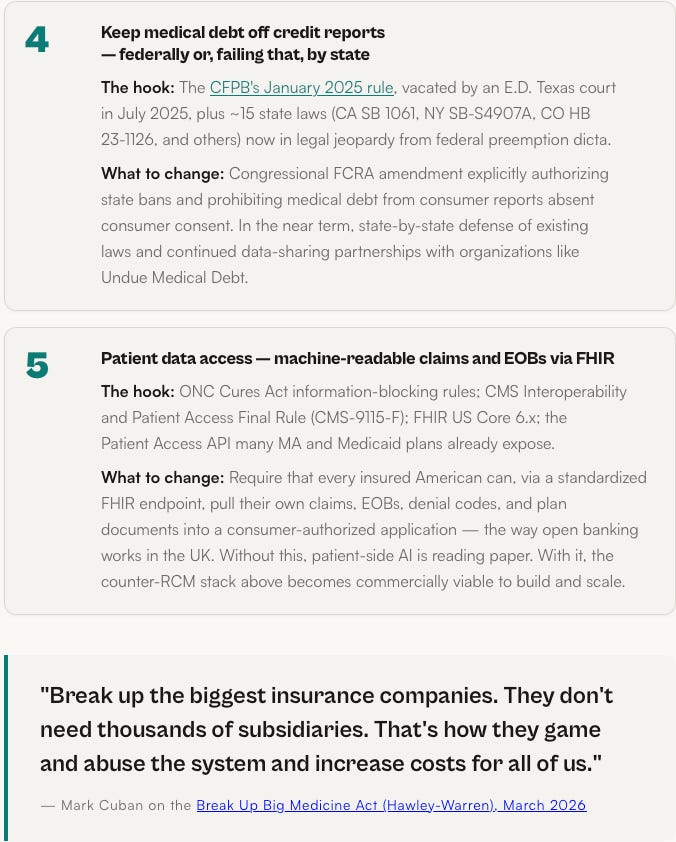
THE POLICY RALLY
Five things that, together, let AI actually work for patients
No single rule fixes medical bankruptcy. But these five are the smallest complete set of changes that would make the counter-RCM stack above commercially viable and legally durable. Each one has an active hook in existing law or regulation.
WHAT HAS TO BE TRUE
The revenue cycle already runs. We just have to let it run both ways.
There is a version of this story that ends with “and then a brilliant AI startup solved healthcare.” Nothing about the evidence above supports that version. 530,000 families a year go bankrupt in this country because of a financing and enforcement structure, not because of a missing app. If anything, the last three years have shown that frontier AI, left to the current incentive structure, tilts the table further — because the side with money to spend on AI is the side already winning, and the side that needs it the most has no budget, no distribution, and no legal access to the data.
The more honest version is quieter. The same signal that powers an RCM engine can power a benefits engine. The same eligibility logic that drives coverage denial can drive automatic charity-care screening. The same natural-language generation that drafts clawback letters can draft appeal letters. The same claims data that identifies high-cost patients for aggressive collection can identify them for presumptive Medicaid enrollment. There is no technical invention missing. There is a set of policy decisions about whose side the infrastructure sits on — and those decisions, unlike physician pipelines or hospital construction, can be made in months.
Cuban’s framing, at the end of the day, is the right one. If you are the CEO of a self-insured employer, an elected official with a healthcare committee seat, an attorney general, a hospital CFO, a nonprofit funder — you do not need to wait for the next model release. You need to decide whether the revenue cycle you authorize runs in one direction or both.
Don’t be a wimp.
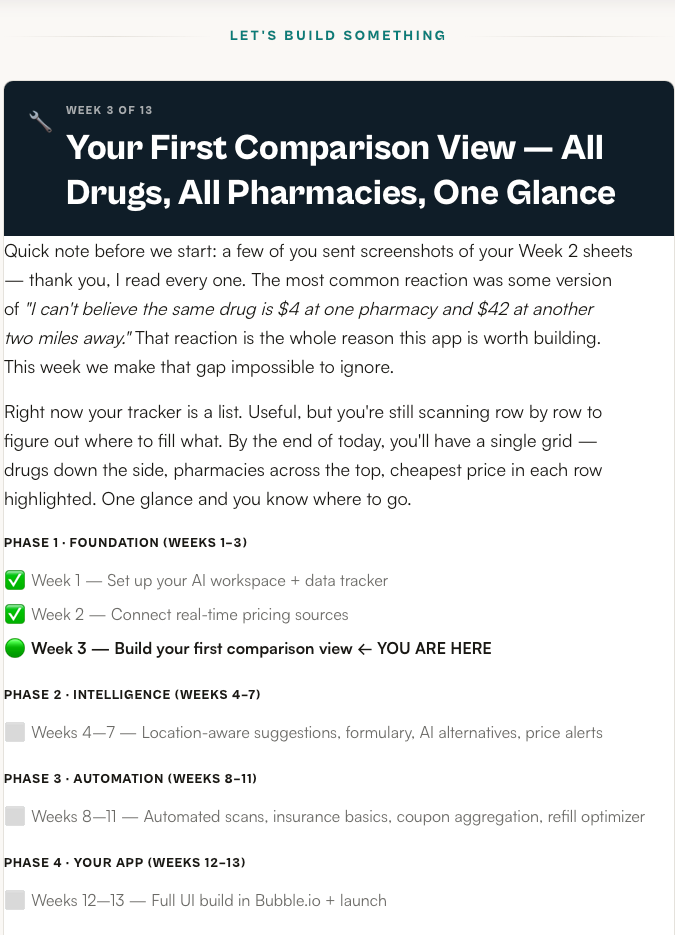
⏱️ THIS WEEK: 15 MINUTES TO THE COMPARISON VIEW
1. Add a Second Tab Called “Comparison” — 1 min
At the bottom of your Google Sheet, click the “+” to add a new tab. Rename it Comparison. Your Week 1–2 data stays exactly where it is on the first tab (rename that one Raw Data if you haven’t already). The comparison view is a derived view — it reads from Raw Data, it doesn’t replace it. Keeping the source of truth separate from the view is the single most important habit we’re building this week. Every real app does this.
2. Paste the QUERY Formula in Cell A1 of the Comparison Tab — 3 min
Click cell A1 on the Comparison tab. Paste the formula below exactly — it pivots your Raw Data into a matrix with drugs as rows, pharmacies as columns, and the lowest price in each cell. Adjust the sheet name in the formula if your Raw Data tab is named differently. If it returns an error, that’s fine — step 3 is how we debug it.
=QUERY(’Raw Data’!A:H, “SELECT A, MIN(D) WHERE A IS NOT NULL GROUP BY A PIVOT C”, 1)
3. If It Broke, Ask Claude (The Point of This Step) — 4 min
QUERY is powerful and picky. If you got #VALUE! or #N/A, open Claude and paste in exactly this prompt, including your column headers and the error message. Don’t worry about sounding technical — that’s what the prompt is for. The goal isn’t to learn QUERY syntax today; it’s to practice the loop you’ll use for every future problem in this build: describe what you have, describe what you want, paste the error, ask for the fix. That loop is the actual skill.
I’m building a pharmacy price tracker in Google Sheets. My “Raw Data” tab has these columns: Drug, Dosage, Pharmacy, Price, Location, Date Checked, Notes, Price Source.
I want a second tab called “Comparison” that shows drugs as rows, pharmacies as columns, and the lowest price for each drug/pharmacy combo in each cell.
I tried this formula in A1 of Comparison:
=QUERY(’Raw Data’!A:H, “SELECT A, MIN(D) WHERE A IS NOT NULL GROUP BY A PIVOT C”, 1)
It returned: [paste your exact error]
What’s the fix? Explain it in plain English and give me the corrected formula.
4. Highlight the Cheapest Pharmacy in Each Row — 3 min
Select the price cells in your comparison grid (not the drug-name column, not the header row). Format → Conditional formatting → Custom formula. Paste: =B2=MIN($B2:$Z2)— adjust the column range to match your sheet. Set the highlight to green. Now the cheapest pharmacy for each individual drug lights up down the grid. That’s the moment this stops being a spreadsheet and starts being a decision tool. Your eye goes straight to where to fill what.
5. Add a “Monthly Savings” Cell — 2 min
In any empty cell below the grid, type: =SUM(cheapest prices) − SUM(most expensive prices) — or more precisely, pick the min and max of each row and sum the differences. Label the cell “Monthly savings if I switch to the cheapest option for every drug.” For most readers this number comes out somewhere between $30 and $200 a month. Write it down. Take a screenshot of the full comparison tab — highlights, savings number, everything. That screenshot is your Week 3 proof of work, and it’s the artifact you’ll send to anyone who asks why you’re building this.
✅ WHAT “GOOD” LOOKS LIKE AFTER 15 MINUTES
✅ Two tabs: Raw Data (source of truth) and Comparison (derived view)
✅ QUERY formula in A1 of Comparison, pivoting drugs × pharmacies
✅ At least one Claude debug loop completed (even if your formula worked first try — practice the muscle)
✅ Cheapest pharmacy highlighted green in every row via conditional formatting
✅ “Monthly savings” cell populated with a real dollar number
✅ Screenshot taken — Week 3 proof of work
If you can look at your Comparison tab and instantly tell me which pharmacy to fill each drug at — and roughly how much it saves you each month — you finished Week 3. The tracker has stopped being a list. It’s a decision tool.
One question worth sitting with before next week: did the cheapest pharmacy turn out to be the same one across all your drugs, or different for each? That answer tells you whether you’re a one-pharmacy household or a multi-pharmacy household — and it matters a lot for what we build next.
Next week: Location-aware pharmacy suggestions. We layer in driving distance so the comparison view doesn’t just show you the cheapest price — it shows you the cheapest price within a realistic driving radius. Sometimes saving $8 isn’t worth a 30-minute detour, and sometimes it absolutely is. Week 4 is where your tracker starts respecting your actual life.